The Random Walk Problem
Imagine taking a sequence of steps, each determined by the flip of a coin. This simple idea lies at the heart of the intriguing random walk problem. It's a bit like a puzzle piece that fits into many different pictures. From understanding how stock prices behave to exploring how tiny particles move, the random walk has proven to be a versatile tool for studying uncertainty and randomness.
Let's delve into solving it statistically and even simulate it using Python
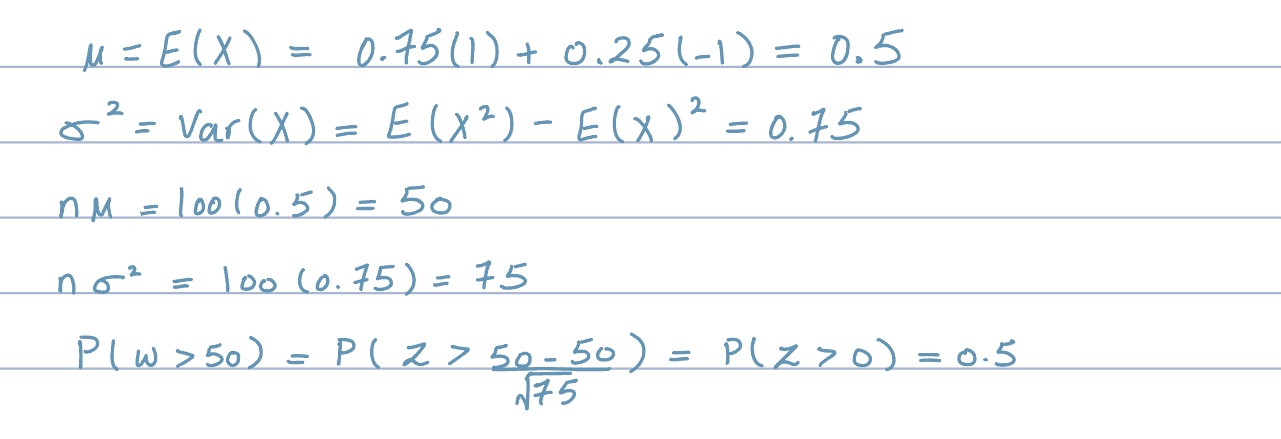
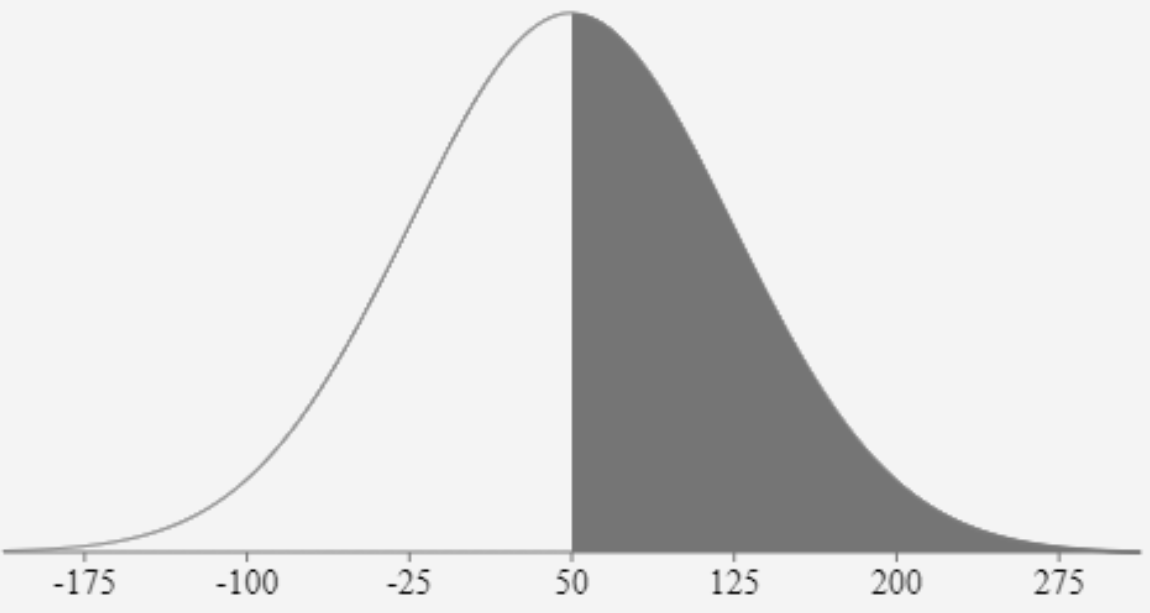
Q1: A walker starts at 0 on the x-axis and at each time unit moves 1 step to the right with probability 3/4 or 1 step to the left with probability 1/4. Estimate the probability that, after 100 steps, the x-coordinate of the walker is more than 50
We will solve the question using the normal distribution. Because, as the Central Limit Theorem states, the sum of a large number of independent and identically distributed random variables will be approximately normally distributed.
let X be our random variable
step to the right = 1
step to the left = -1
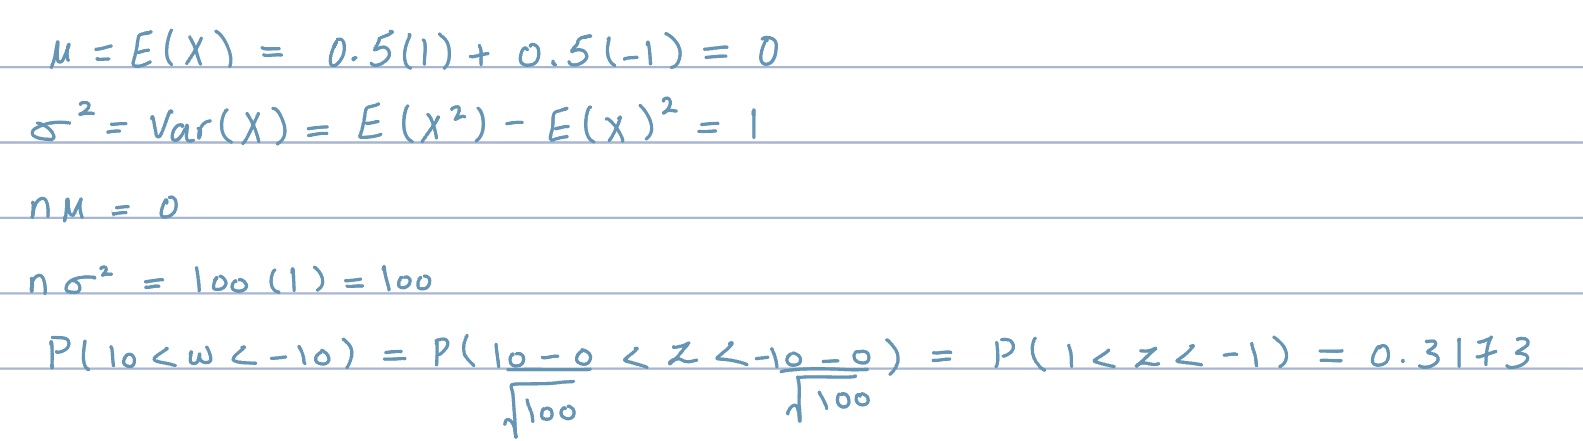
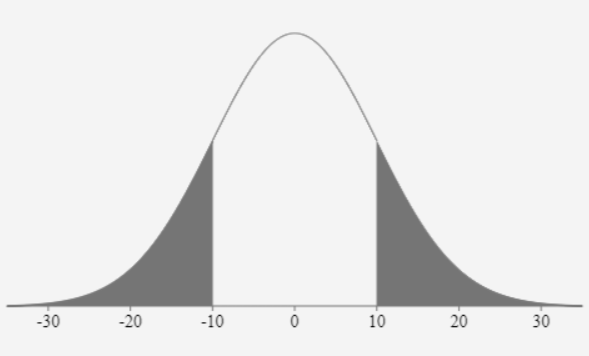
Q2: A walker starts at 0 on the x-axis and at each time unit moves 1 step to the right or 1 step to the left with probability 1/2. Estimate the probability that, after 100 steps, the walker is more than 10 steps from the starting position.
let X be our random variable
step to the right = 1
step to the left = -1
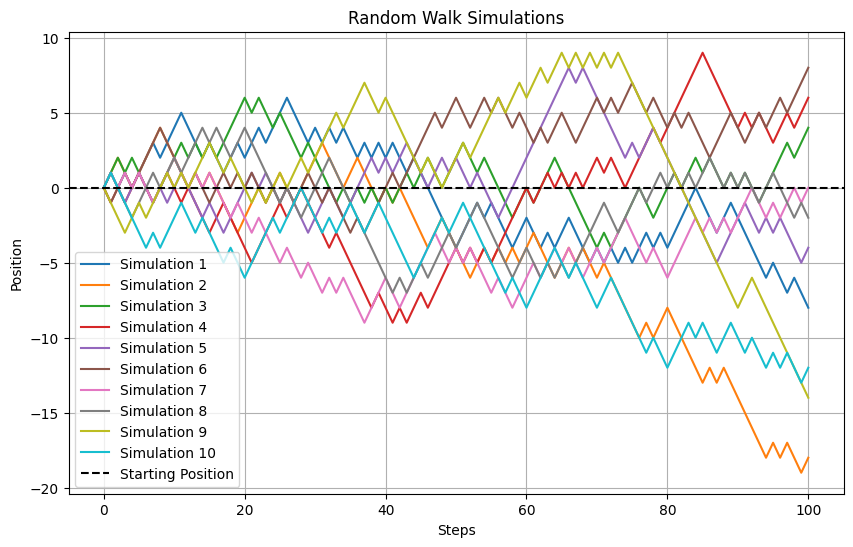
Python simulation
import random
import matplotlib.pyplot as plt

def simulate_walker(steps, simulations):
    count = 0
    positions = []
    for _ in range(simulations):
        position = 0
        positions.append([position])
        for _ in range(steps):
            move = random.choice([-1, 1])
            position += move
            positions[-1].append(position)
        if abs(position) > 10:
            count += 1
    return count / simulations, positions

steps = 100
simulations = 10
probability, positions = simulate_walker(steps, simulations)
print(f"Estimated probability: {probability}")

plt.figure(figsize=(10, 6))
for i, pos_list in enumerate(positions):
    plt.plot(pos_list, label=f"Simulation {i+1}")

plt.axhline(y=0, color='black', linestyle='--', label='Starting Position')
plt.xlabel("Steps")
plt.ylabel("Position")
plt.title("Random Walk Simulations")
plt.legend()
plt.grid()
plt.show()

Output:
Estimated probability: 0.3